
House Prices v OCR
What actually happened to NZ house prices the last three times the OCR rose
When rates go up, a lot of investors step back. This free one-page analysis charts what the data shows, so you can form your own view.
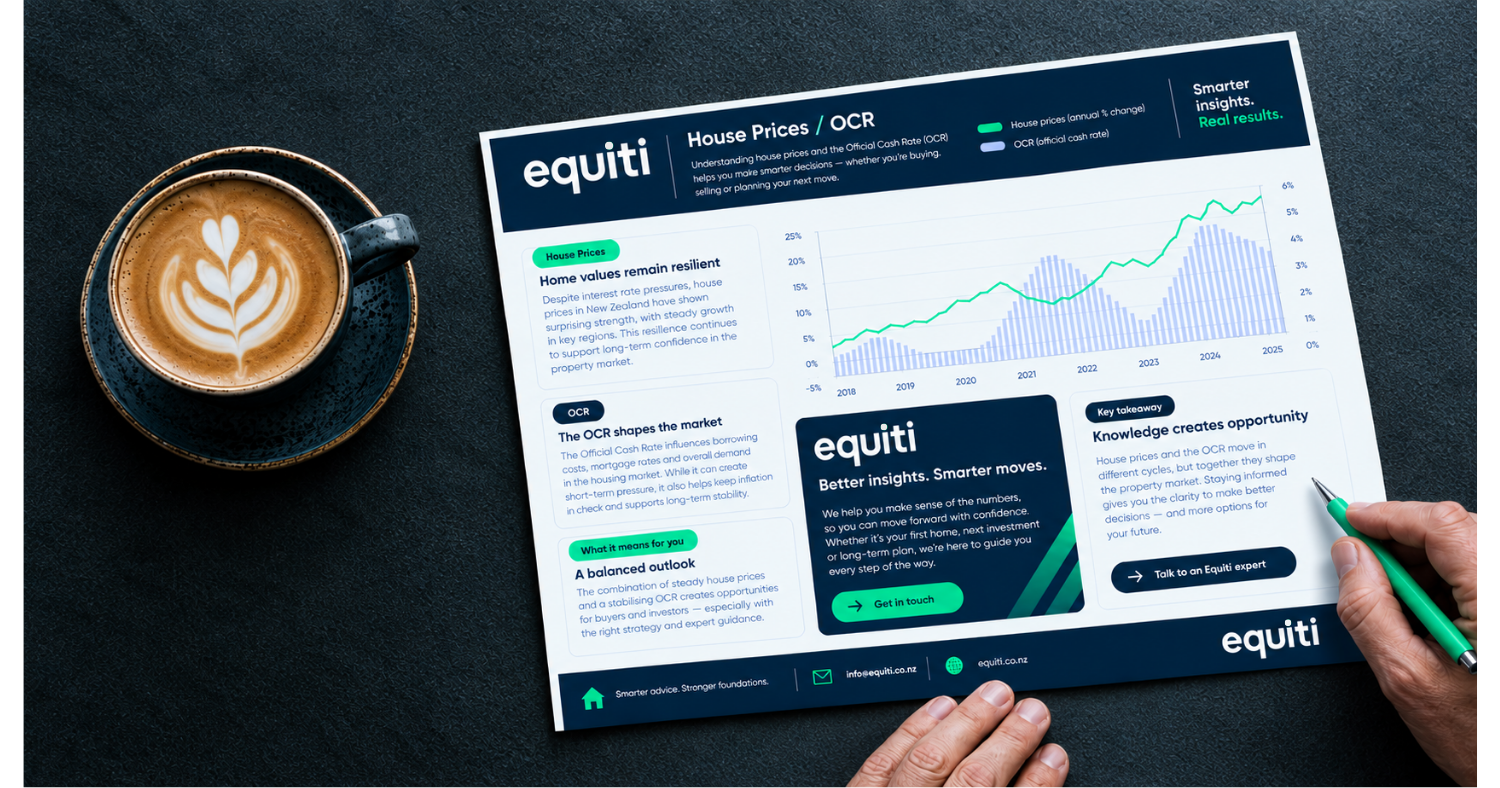
Interest rates move and the headlines follow. What tends to get lost is what actually happened to house prices last time, and the time before that. This one-page analysis charts NZ median house prices across the 36 months following three OCR increases, each of which came after a prolonged period of low or falling rates. The patterns are presented for your consideration.
Free to download. Takes 30 seconds to request.
Why This Analysis
Most people react to rate news on instinct. This is what the record shows.
When the OCR rises, the instinct is to wait. It feels prudent, and sometimes it is. But the decision usually gets made on how the news feels rather than on what happened the last time conditions looked like this.
This analysis doesn't tell you what to do. It charts three specific occasions in recent New Zealand history, sets out what median house prices did over the following three years, and leaves the conclusion to you. If you prefer to look at the data before forming a view, this is for you.

Our 3 Step Proven Process




Introductory Call
A 15-minute conversation to work out whether property investment fits your goals. If it does, we'll book you a Discovery session. If it doesn't, we'll point you in a better direction.
Step 1: Discovery Call
A 45–60 minute video call where we go through your finances and what you're working toward. You'll leave with a clear picture of your retirement gap and a plan grounded in your actual numbers.
Step 2: How-To Meeting
A 45–60 minute session showing how a tailored property strategy closes that gap. We cover the key concepts and walk you through what a personalised portfolio could look like.
Step 3: Asset Selection
A 60-minute meeting where we present three data-backed investment options matched to your profile. You'll review cash flow forecasts, ask whatever you need to, and choose a property with confidence.
What's Inside
Three OCR increases, three years of house price data, one page
Everything is charted and sourced, so you can see the working. Here's what's covered:
- Three OCR increases, each following a prolonged period of low or falling rates, with the dates and figures set out.
- What NZ median house prices did across the 36 months after each one.
- Where the numbers come from — REINZ HPI Reports for median house prices, Reserve Bank of New Zealand for OCR decisions.
- What the data doesn't tell you, including the factors beyond interest rates that move house prices.
- The questions worth asking before you decide whether to act or wait.
Get Your Free Analysis
Pop in four quick details and it's yours
We've kept this simple on purpose. Add your details below and we'll send the analysis straight to your inbox, then take you to your download in a click.
Want to talk it through?
Read the analysis first. If you'd like to discuss what it might mean for your own position, book a free 15-minute Clarity Call and we'll have a straight conversation about it.
Free to download, no strings attached.